


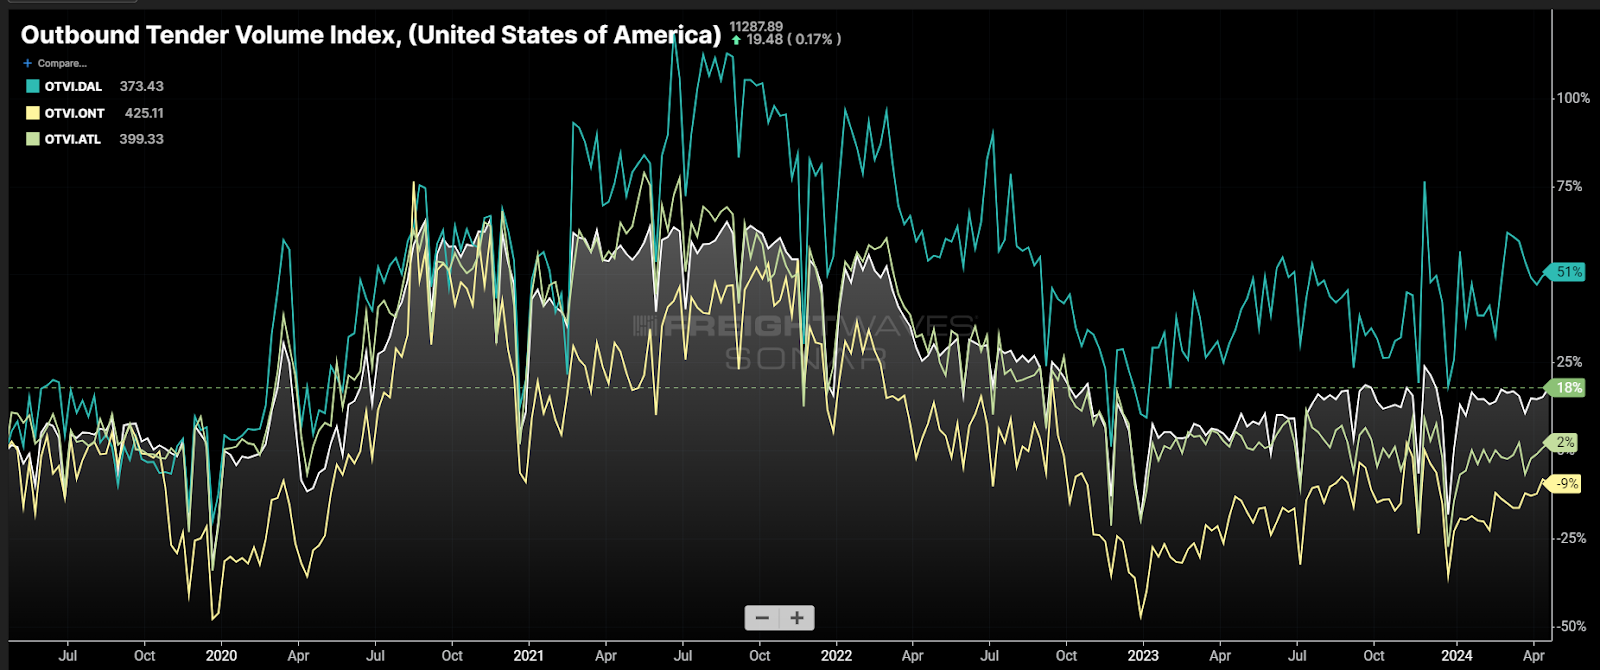
Chart of the Week: Outbound Tender Volume Index – USA, Dallas, Ontario, Atlanta SONAR: OTVI.USA, OTVI.DAL, OTVI.ONT, OTVI.ATL
Dallas’ outbound tender volumes (OTVI.DAL) have grown approximately 50% over the past five years compared to the national average of 18%. The two largest outbound markets in the U.S. — Ontario, California, and Atlanta — have both lost significant share. The ongoing capacity glut is hiding a rather significant shift in national freight flow patterns.
In a more balanced market, freight demand changes are discovered through isolated pockets of tightening, where spot rates increase and carriers flock to cover the freight. In the current market, where supply is abundant, there is no tightening or increased rates as carriers are nearly sitting on the sides of the streets ready to pounce.
Five years may sound like a long time, but in terms of supply chain infrastructure it is relatively brief. The process of deciding where to place and then build warehouses and distribution centers takes many years.
The pandemic-fueled economic volatility has possibly created a sense of urgency around diversifying procurement and sourcing strategies. The results of this have fractured a stagnant national freight transportation network that had been entrenched for at least a decade.
This isn’t to say that this shift has completely rearranged freight across the U.S. Ontario and Atlanta remain the largest outbound markets, but their dominance has waned significantly as they have lost share to some of the smaller markets.
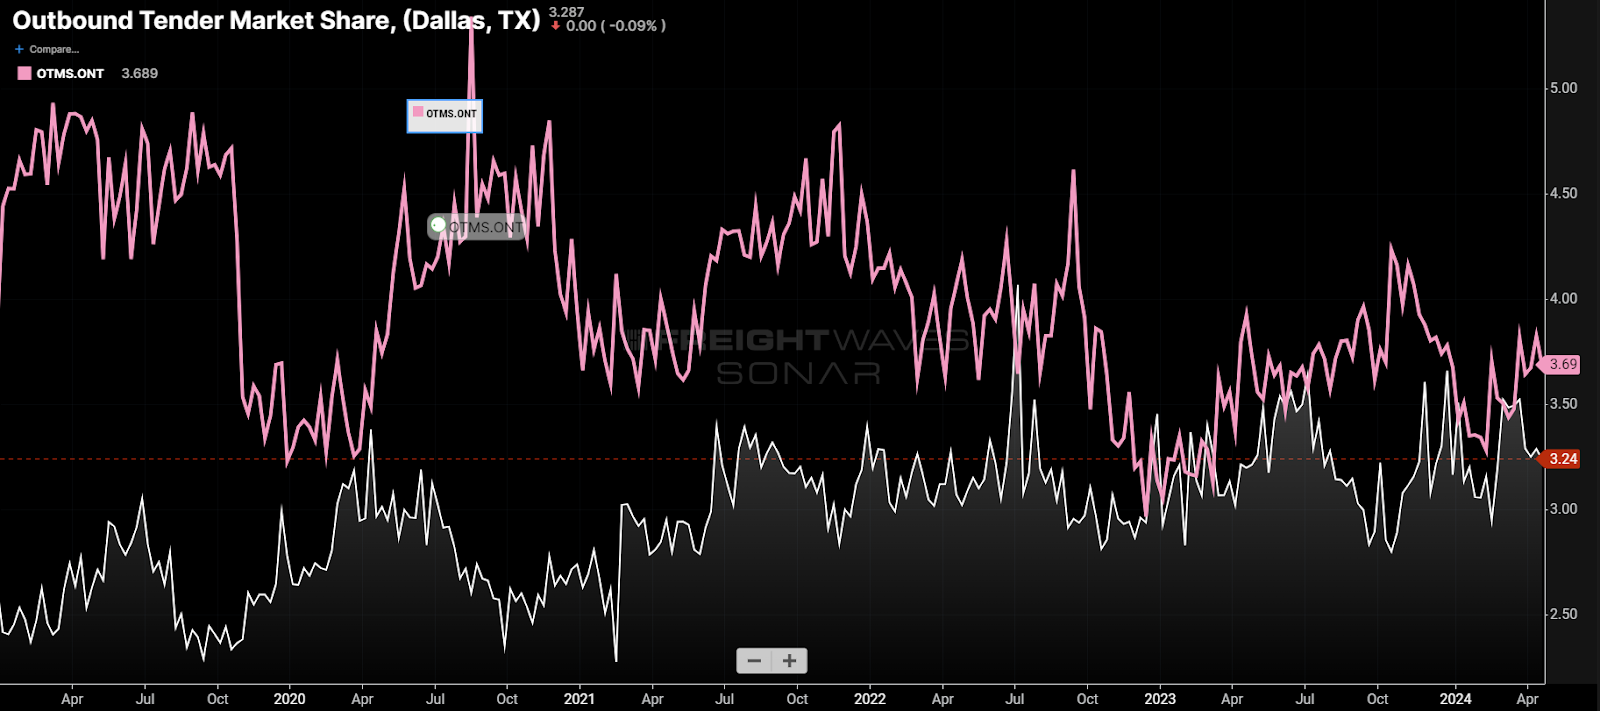
The Dallas market was not a small market in 2019, representing approximately 2.7% of the total national outbound freight volume (or market share) that April. It has averaged around 3.3% this month. Ontario has shrunk from a 4.8% Outbound Tender Market Share (OTMS) value to 3.7%.
Dallas is not the only market that has grown significantly relative to the others. Phoenix demand is up approximately 60% since April 2019 and currently originates over 2% of all national tenders compared to about 1.1% five years ago.
While changes in market share do not necessarily mean a market has grown or deteriorated in terms of absolute freight volume, it does mean that transportation networks have to adjust to meet the needs of shippers.
Carrier networks are built on consistency and knowing when and where freight will be available. Changes in either of these mean that carriers need to find a way to get their trucks into the places they are needed more often.
If they are unaware of these shifting patterns, thanks to a veil of abundant capacity, then they will not be actively trying to adjust. It takes several months for a carrier to rebalance its network.
The reason this is important is that once capacity recedes to a more balanced level with demand, trucking rates will go through their own rebalancing. This will mean some areas of the country will have lower rates, while others will see increases. The areas that have fallen out of balance will also be more exposed to service disruptions.
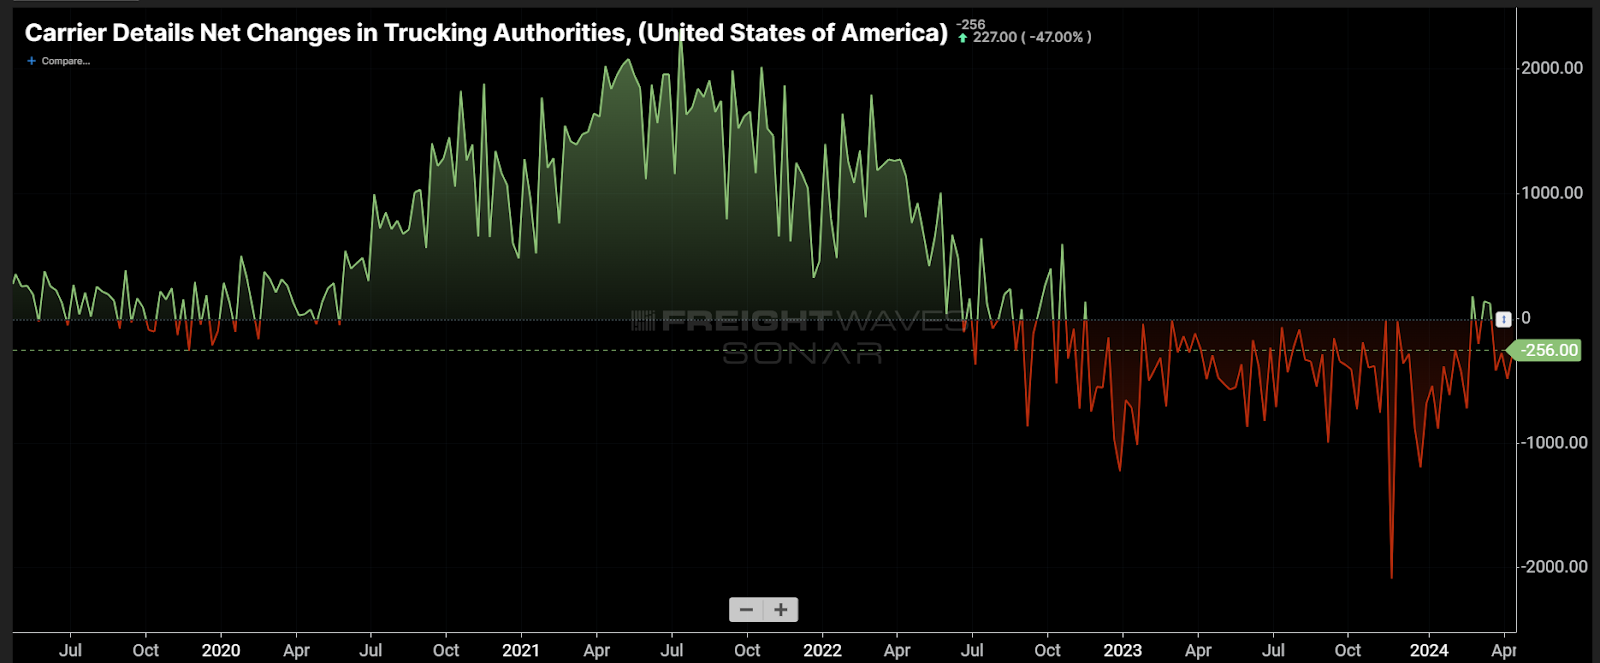
Capacity is exiting at a record pace, according to Carrier Details analysis of Federal Motor Carrier Safety Administration data. Many expect the market to be more balanced later this year, which will expose these freight transportation pattern shifts more prominently.
Shippers who have facilities in these emerging markets should be wary of changing pricing conditions. Service providers should be proactive in targeting these areas operationally.
About the Chart of the Week
The FreightWaves Chart of the Week is a chart selection from SONAR that provides an interesting data point to describe the state of the freight markets. A chart is chosen from thousands of potential charts on SONAR to help participants visualize the freight market in real time. Each week a Market Expert will post a chart, along with commentary, live on the front page. After that, the Chart of the Week will be archived on FreightWaves.com for future reference.
SONAR aggregates data from hundreds of sources, presenting the data in charts and maps and providing commentary on what freight market experts want to know about the industry in real time.
The FreightWaves data science and product teams are releasing new datasets each week and enhancing the client experience.
To request a SONAR demo, click here.

Mark
👍
Mark Stephens
The Supply Chain Pendulum Swing
An observation by Mark Stephens
Volume capacity. Outbound tender volumes. Spot market rates. These are but a few terms used in the trucking industry within the United States supply chain.
As with any cost to profit business supply and demand remains the critical constant by which one makes predictive analysis.
In a balanced market, freight movement compares nicely to trucking capacity. Trucking capacity is the measurable available units bidding for loads; these loads are often found on load boards such as DAT, CR Robinson, 123Loadboard to name a few.
In today’s current market we find ourselves in a conundrum as such. Where supply is abundant, but so too are empty trailers whose movement depends on quick timing and flexible negotiated compromising techniques by planners and dispatchers.
Pre-pandemic figures categorize nicely into the predictive ebb and flow of the pendulum swing supply chain. The pendulum swing you ask? Essentially it’s the range of profit margins targeted and often surpassed within the supply chain participant namely the shippers and receivers also known as customers and that of the carriers and brokers. Ironically, the margins have hovered in the 30% for either partner. That is before the 2020 covid era. The supply and demand formula was absolute during this time due to the unpredictable consumer buying phases. Production plants, distribution centers and off market third party logistic warehousing begin over ordering and quickly filling beyond maximum capacity. This exasperated increase to the normal pendulum swing was a primary effect of rate escalation.
Carriers, owner operators and brokers reacted in similar fashion akin to the California Gold Rush of the mid 1800s or the oil fracking business in recent years. Carriers and owner operators began purchasing additional equipment then was available such as semis and trailers, old and new. One couldn’t find a semi for sale at that time, but if a truck was located the sale price was at least 50% over the normal value just a mere a few months prior.
As far as the new trucks, orders are being taken a year in advance. Only problem was the computer chip issue which was currently being delayed during development in China perhaps politics played a role, nonetheless the entire concept could be called greed by those in the trucking industry. Actually the answer was well… it was greed.
As a retired history teacher, I do recall 19th century philosopher George Santayana’s century old adage, “by not knowing relative history, there’s an excellent chance of repeating similar failure.” Doomed or condemned I believe was the operative adjective used.
The trucking capacity grew at an alarming scale yet the demand to move product remained the carrot to the thoroughbred. Rates were at their highest ever measured and the pendulum needle could not have reached any further than it did before the adverse effect began.
By the time carriers had received their pre-ordered trucks and trailers in 2023 the reflux of the pendulum began moving in favor of the shipper and receiver (customer) where it currently lies, albeit in a slow decline.
The anomaly is trucking capacity is still extremely high in spite of some of the lowest rates offered and agreed upon. Add that to the rise in fuel cost in 2023 the supply chain industry saw a devastating rise and carrier and broker bankruptcies with thousands either going out of business or parking their units.
Large carriers had a much better chance of surviving due to its potential cash flow and mixed with cost cutting actions compared to the SMB carrier.
Many analysts predict a settlement back to pre-pandemic normality this year. That’s wishful “hopeful” thinking. Bizlytics predicts spring of 2025 to measure closest to pre-pandemic volumes save fuel ventures.
The needed transparency within the supply chain would require one of the two partnerships to take it on the chin, so to speak, in order to balance this pendulum range and minimize it’s volatility. If an agreement was achieved to neutralize the influx of supply chain movement through supply and demand predictives and attainable profit margins would fall in a satisfactory target range the survival of all participants would become a reality; at least until the next pandemic.
Technology is moving along quite well. AI is becoming a more understood ally to the supply chain partnerships and those who exercise that technology will transcend to the top and to those who let’s say wing it, on their instincts, well let us not forget Dr. Santayana’s famous quote.
Mark Stephens